Harnessing the Power of Construction Dashboard in Power BI
The construction industry is a complex and dynamic sector that requires effective management of various aspects such as project planning, resource allocation, cost control, and risk management. To streamline these processes and improve decision-making, many construction firms are turning to data analytics tools like Power BI.
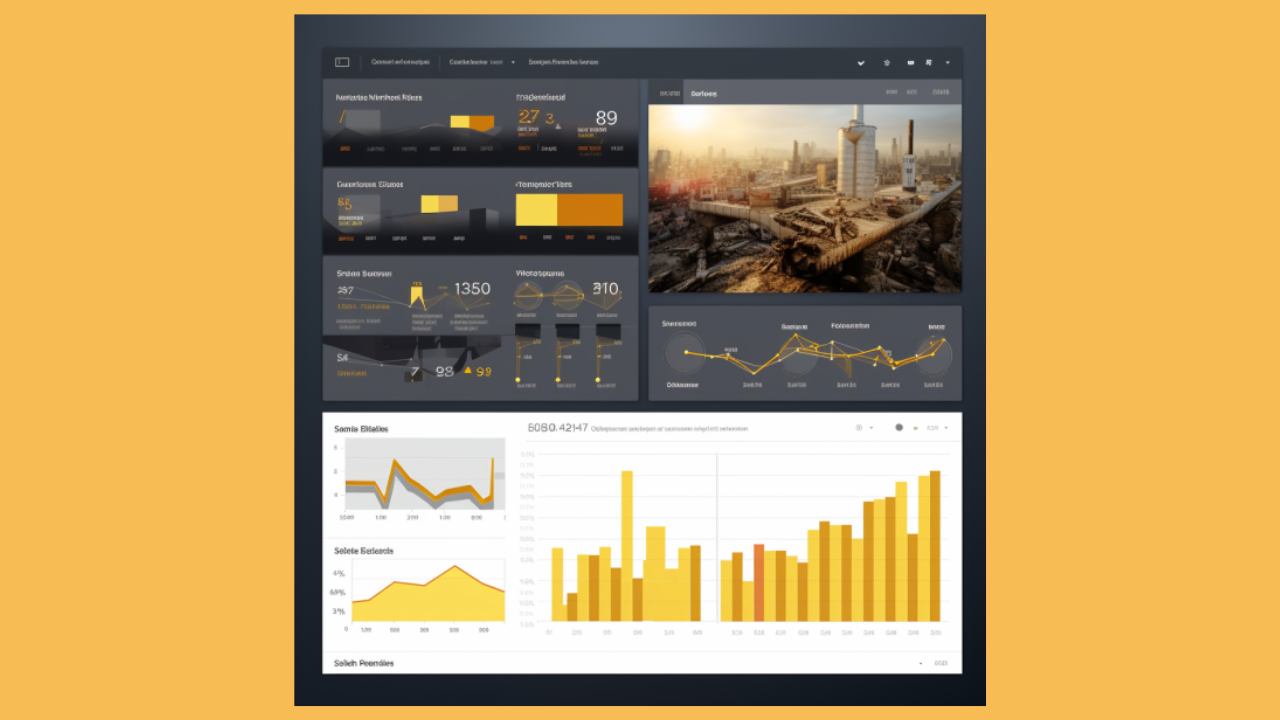
One of the most potent features of this tool is the construction dashboard in Power BI. This blog post will delve into how Power BI reporting for construction can revolutionise operations in this industry.
Understanding Power BI in Construction
Power BI (Business Intelligence) is a suite of business analytics tools developed by Microsoft that allows you to analyse data and share insights. It provides interactive visualisations with self-service business intelligence capabilities. In the context of construction, Power BI can be used to create a comprehensive dashboard that displays all critical project metrics in one place.
The construction dashboard in Power BI offers a real-time view of various project aspects such as budget status, project timeline, resource utilisation, and risk factors. This empowers stakeholders with actionable insights to make informed decisions promptly.
Benefits of Creating Construction Dashboards in Power BI
Streamlined Project Management
Power BI reporting for construction provides an overview of all ongoing projects at a glance. It allows managers to track progress against set timelines and budgets effectively. By integrating data from various sources like Excel spreadsheets, cloud services, streaming data, and on-premises SQL Server databases, it provides a unified view of all project-related information.
Enhanced Cost Control
One significant challenge in the construction industry is managing costs effectively. The construction dashboard in Power BI enables managers to monitor expenses closely against allocated budgets. It offers insights into areas where costs may be escalating and helps identify potential cost-saving opportunities.
Improved Risk Management
Construction projects often face numerous risks ranging from safety hazards to financial risks. With Power BI reporting for construction, these risks can be identified early on and mitigated effectively. The dashboard provides visual representations of risk factors, making it easier for managers to understand and address them.
Increased Efficiency
By providing real-time data and insights, the construction dashboard in Power BI helps improve efficiency across the board. It eliminates the need for manual data collection and analysis, freeing up time for teams to focus on more strategic tasks. Additionally, it promotes transparency and accountability among team members by providing clear visibility into project status.
How to Set Up a Construction Dashboard in Power BI
Setting up a construction dashboard in Power BI involves several steps:
1. Data Collection: Gather all necessary data from various sources like project management tools, financial systems, etc.
2. Data Integration: Import this data into Power BI and integrate it to create a unified dataset.
3. Dashboard Creation: Use Power BI's drag-and-drop features to create visualisations such as charts, graphs, and tables that represent your data effectively.
4. Customisation: Customise your dashboard based on your specific needs. You can add filters, drill-down features, and other interactive elements to make your dashboard more user-friendly.
5. Sharing: Once your dashboard is ready, you can share it with stakeholders via email or publish it on the web for broader access.
Check out examples of this works with our integrated Key Insights.
The construction industry is increasingly becoming data-driven as firms recognise the value of leveraging data for decision-making. The construction dashboard in Power BI is a powerful tool that enables efficient project management, cost control, risk management, and overall operational efficiency. By harnessing its capabilities, construction firms can gain a competitive edge in today's challenging business environment.
Remember that setting up an effective construction dashboard requires not just technical know-how but also an understanding of your specific business needs and objectives. Therefore, consider seeking professional help if needed to ensure you get the most out of your Power BI reporting for construction.

Will Doyle
CEO
I am an experienced RICS chartered Quantity Surveyor with first-hand experience of how the consistent capture and analysis of data can transform global project delivery.

Keep up with Raildiary
Make sure you never miss out! Sign up to our weekly newsletter to keep up with the biggest news stories in construction and the latest Raildiary updates. Full of our latest case studies, blogs and fun quizzes!